Here on the ULC Monastery blog we like to bring our readers' attention to the current state of the social justice landscape. Because a big part of the church's mission is to forge a sense of equality and solidarity, we are always striving to expose and break down the barriers which divide people. That's why we get ordained online. Certain belief systems concentrate in some regions more than others, presenting impediments to progress for traditionally marginalized groups such as women, blacks, gays, and children. By looking at maps which show the distribution of beliefs and attitudes across the United States, we get a general idea where to begin our work as Universal Life Church ministers.
We can start this work by looking at the political attitudes, which frequently overlaps with social ones. Consider the following maps of the 2008 U.S. presidential election. The first map shows states with red, Republican majorities, and those with blue, Democratic majorities; the second one shows this same information, but with a focus on population density.
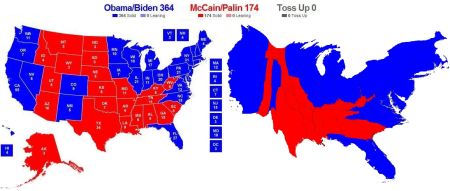
As we can see, Republican voters were clustered in the south, the Great Plains, and the interior west, while Democratic voters were clustered in the northeast, Great Lakes, and west coast. As it so happens, the red areas also generally reflect sparsely populated areas, and the blue areas, more densely populated areas, revealing a correlation between cities and Democratic values.
But does the Republican-Democrat divide reflect something more than just urban versus rural? If we look at the following Gallup maps from 2011 and 2010, respectively, we get a better idea how conservatives and liberals are distributed across the country.
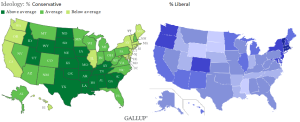
Not only are the northeast and northwest regions predominantly Democratic and urban, but they are also decidedly more liberal than the south and the midland. (The midland tends to be a grey area, as we shall see.) The ideological divide along geographical lines begins to deepen. Urbanity, Democratic politics, and liberalism begin to characterize the northeast and west coast while rurality, Republican politics, and conservatism begin to characterize the hinterland.
The regional difference comes into even sharper focus when we look at education and religiosity in America. Below is a 2009 Gallup map showing the most religious and most secular states in the country as well as a 2000 Census Bureau map showing educational attainment.
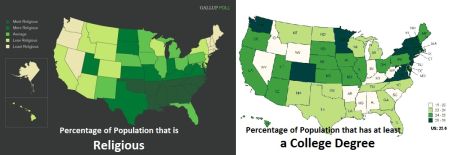
As the first map suggests, the south is much more religious than average, while Cascadia and New England are much more secular than average. The second map shows the inverse for education: the more secular areas tend to have better-educated people, and the more religious areas tend to have less-educated people, especially when we compare Washington state and Massachusetts with Mississippi. What this seems to show is that religiosity and lower educational attainment pattern together in the south, while secularism and higher educational attainment pattern together in New England and Cascadia (anchored by the cultural and educational centers of Boston and Seattle, respectively).
This ideological divide becomes particularly important when we look at the history of black civil rights in the United States. Consider these maps on slavery and anti-miscegenation laws:
It's probably no surprise that the south consisted almost entirely of slave states, and the north and west almost entirely of free states and territories. Nor is it surprising that the map of anti-miscegenation laws so closely follows this pattern, with the south resisting the repeal of racist marriage laws until 1967, over one hundred years after slavery was abolished. The south wasn't always overwhelmingly Republican, though: the region was full of "Dixiecrats" when the liberal Democrat and conservative Republican binary was not as stark as it is today.
But this general pattern of a blue, liberal region wrapping around a red, conservative hinterland doesn't end with race; it also shows up in opinions about women, women's rights, and sex differences, as illustrated in the following maps of women's suffrage laws and attitudes about abortion.
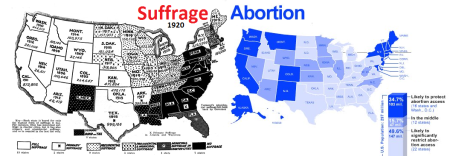
In the suffrage laws map, the divide between a conservative south and a liberal north and west is slightly blurred. Large parts of the northeast joined with the south in resistance to suffrage, but vast parts of the west and northwest remained progressive on this issue, in stark contrast with the south. The north-south binary reappears, however, in the 2006 abortion map, which shows a northeast and west coast far friendlier toward reproductive rights than the south.
The south's apparent concern for unborn babies seems incompatible with its poor record on child welfare. We see another stark regional difference looking at maps of state-by-state child poverty rates and overall child welfare across the United States.
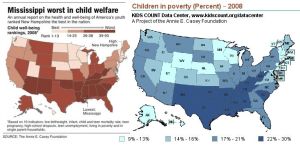
On the 2008 child welfare map, children are better off in the lighter-shaded areas, which include Washington state, Utah, the Upper Midwest, and New England, but they are worse off in the south--the same part of the country where women's rights, black civil rights, and post-secondary educational attainment tend to lag behind, and where religiosity tends to flourish. A very similar pattern holds for child poverty rates, with a dark band of impoverished children in the south and a lighter strip of well-off children in the west, north, and northeast.
No discussion of American social attitudes would be complete without mention of gay rights, which seems to be the social justice zeitgeist of our time. Once again, the general pattern we have been seeing holds true when we look at the maps below showing the advance of gay rights in the United States.
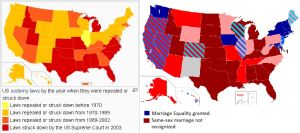
The first map shows the northeast, Midwest, and west coast taking the lead in knocking down old laws banning sodomy between consenting adults in the privacy of their own homes. Most of the south (as well as Mormon country) had to be forced by a 2003 Supreme Court ruling to catch up with the rest of the country. And, in typical fashion, the northeast, Midwest, and northwest shine bright blue as the beacons in the gay marriage movement, while the south and Great Plains are steeped in a mostly dark blood red. We must take care not to lump the entire south into the category of "retrogressive", however: one former slave state--Maryland--is also a gay marriage state.
Certainly, looking at a few maps gives only a rough portrait of shifting social attitudes, and much more investigation is required to yield a truly refined and nuanced picture of the issue, but we can still get a general idea where American attitudes lie with respect to the rights of women, racial minorities, sexual minorities, children, etc. As ministers ordained online, we can use this kind of knowledge to focus our ministries on helping those who have been targeted for oppression. It isn't a matter of judging--it is a matter of showing compassion. With the facts in mind, we can become a minister to reach out to disenfranchised minorities, abused children, poor people who don't have money for college, young pregnant women with no access to reproductive health-care, and bullied gay youth with nowhere to go. After all, the goal of the ULC minister is to bring people together despite their differences, for we are all children of the same universe.

0 comments